This week’s tasks:
- Consolidated all scraped data from all different websites into one master file to be used for data analysis.
- Data Analysis:
- Imported necessary packages in Juypter Notebook for data analysis.
- Started cleaning the data: Missing values, fixing datatypes
- Started exploring the data using various visualizations.
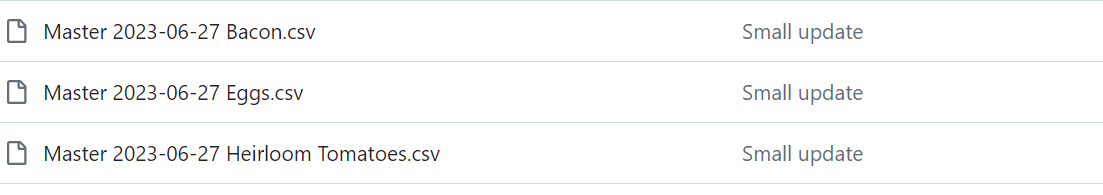
Data Consolidation
Consolidated all collected data in three master lists of Eggs, Bacon and Heirloom tomato respectively.
This would let work separately on each product’s data set and would give us more insights about the dataset.
Data Analysis
Started the data analysis by importing the necessary packages, we will keep adding more packages as we go along with analysis part.

Cleaning:
We found there were a lot of missing values in our data set for various columns
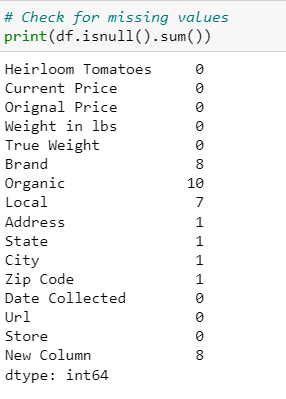
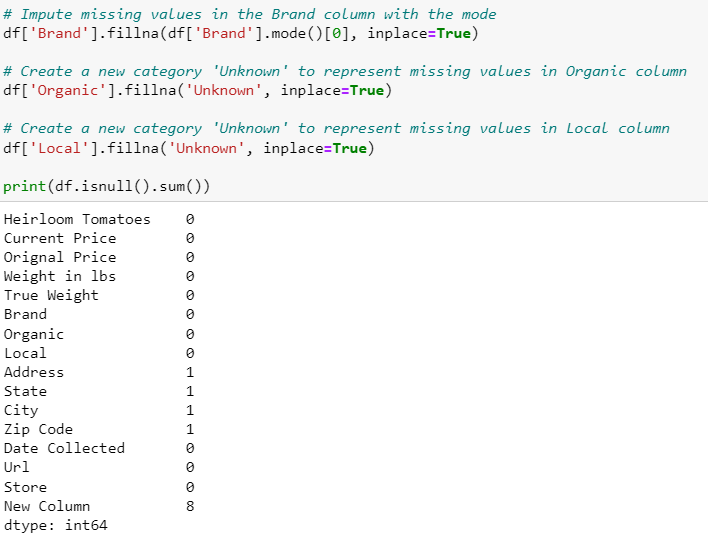
We dealt with missing values for filling NA like shown in the snapshot below:
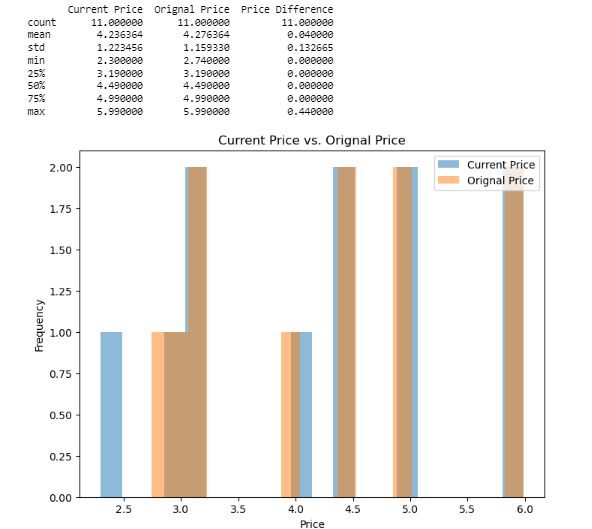
Price Analysis:
we can analyze the relationship between the current price and the original price of the heirloom tomatoes.
This analysis can help you understand the pricing trends and calculate potential discounts or price differences.
Visualize the distribution of current prices using histograms, box plots, or kernel density plots to gain insights into the pricing range and identify any outliers.
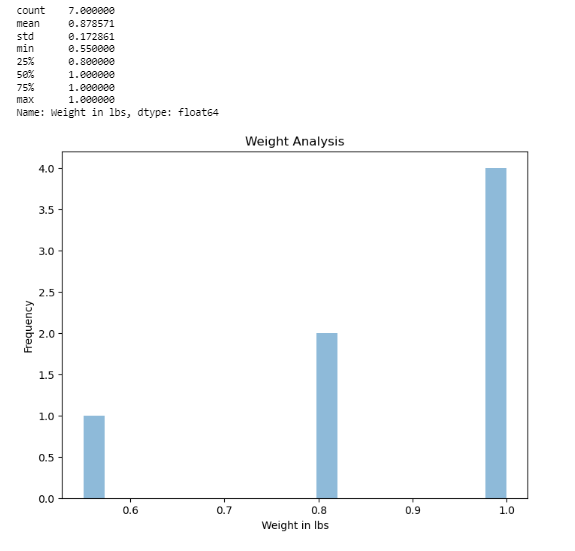
Weight Analysis:
Analyze the weight of the heirloom tomatoes by comparing the weight in pounds and the true weight.
This analysis can help you determine if there are any variations in weight and assess the accuracy of weight measurements.
Creating scatter plots or line plots to visualize the relationship between weight in pounds and true weight.
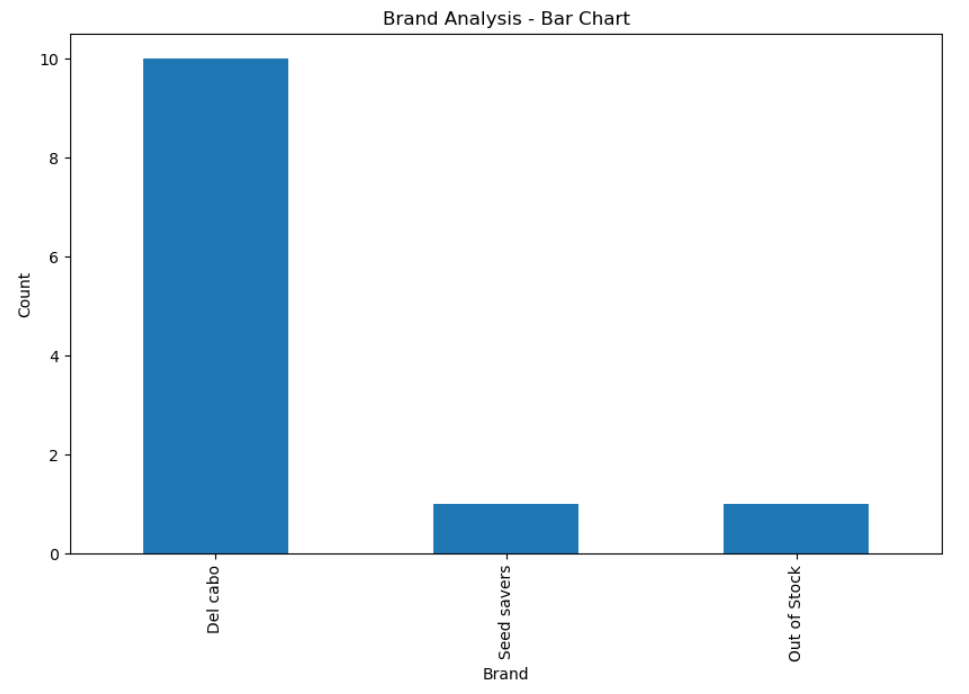
Brand Analysis:
Analyze the different brands of heirloom tomatoes available in the dataset. Calculate the frequency of each brand to determine the most popular ones.
Creating a bar chart and pie chart to visualize the distribution of brands and identify the market share of each brand.
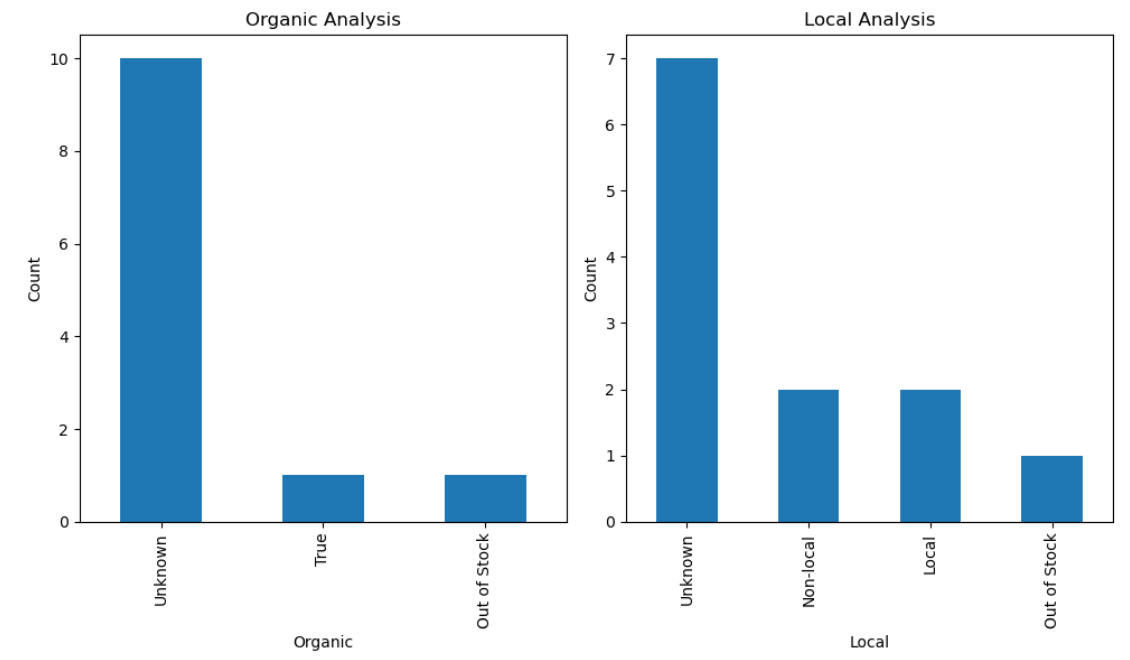
Organic and Local Analysis:
Analyze the presence of organic and locally sourced heirloom tomatoes. Calculate the percentage of organic and local products in the dataset. Creating a bar chart or pie chart to visualize the proportion of organic and local tomatoes.